Explainer: What does Rust Belt’s continued decline reveal about American capitalism
By Ali Zeraatpisheh
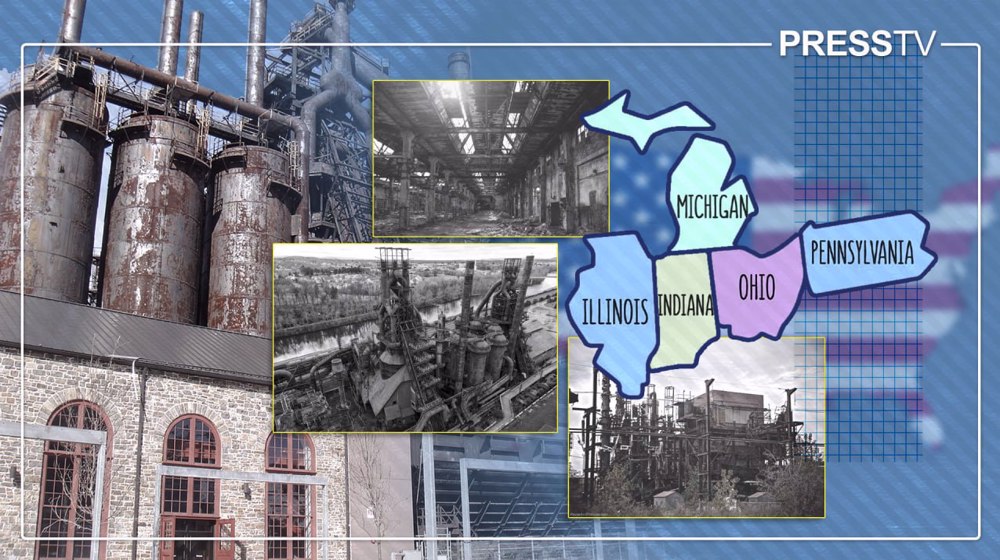
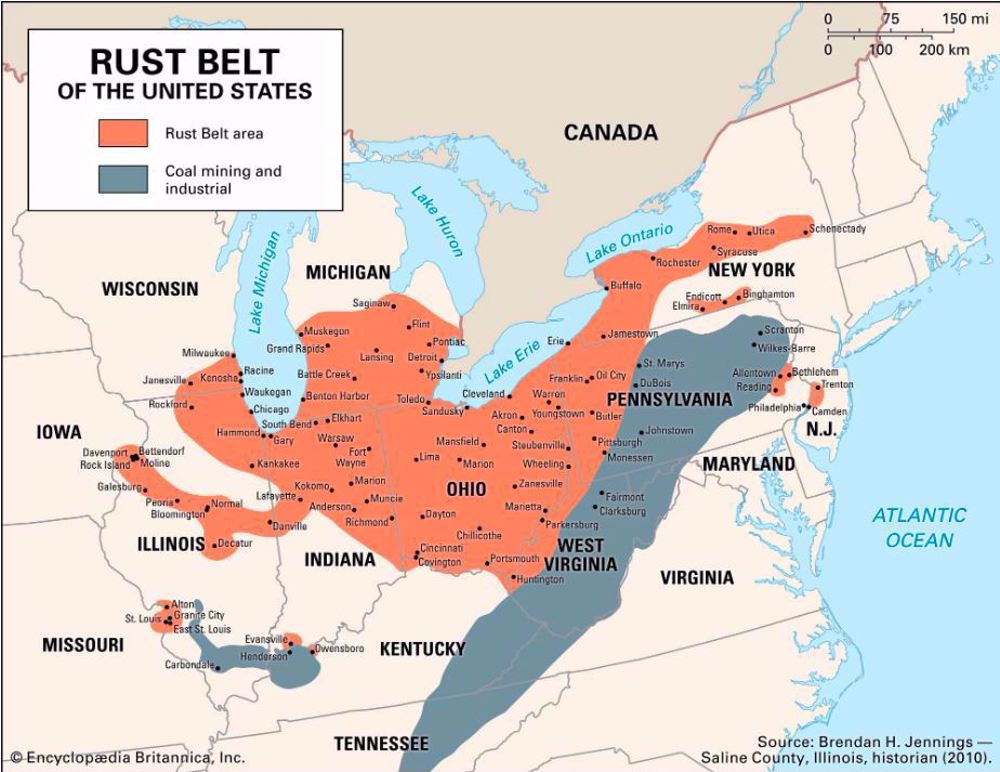
The Rust Belt refers to a broad swath of the American Midwest and Great Lakes region that once anchored the country’s industrial might but is now effectively abandoned.
For much of the twentieth century, cities here relied heavily on steel, automobiles, rubber, machinery, and other forms of heavy industry. In 1950, roughly 44 percent of total US employment was concentrated in these states, including more than half of all manufacturing jobs.
The region was not merely important to the national economy, but one of its foundations.
By 2000, this position had eroded significantly. The Rust Belt’s share of total employment had fallen to around 28 percent, and its share of manufacturing jobs dropped to about one-third. This decline was gradual yet persistent, beginning well before the twenty-first century.
The shift cannot be explained solely by the nationwide decline in manufacturing. Even within the sector, production and jobs increasingly migrated elsewhere, weakening the Rust Belt from within.
The contraction intensified between 2000 and 2010. During that decade, the six Great Lakes states most closely associated with the Rust Belt saw an estimated 35 percent drop in manufacturing employment, roughly 1.6 million jobs lost.
In percentage terms, this decline exceeded the losses of the Great Depression. The repercussions extended beyond employment: employer-provided pensions and defined-benefit plans, once a cornerstone of industrial workers’ financial stability, collapsed. In 1998, roughly half of Fortune 500 firms offered such plans; by 2015, only about 5 percent did.
Post-2010 data show only a limited recovery. While some manufacturing jobs returned in the 2010s, these gains replaced only a fraction of earlier losses. Manufacturing’s share of total private employment remains far below historical levels.
The story of the Rust Belt, therefore, is not one of sudden collapse followed by rebound. It reflects a prolonged, structural transformation, marked by deep losses, uneven recoveries, and lasting economic change.
How did the industrial collapse happen in this region?
The economy of the Rust Belt continues to reflect decades of industrial decline. By 2025, total manufacturing employment in major states such as Michigan, Ohio, Pennsylvania, Indiana, and Illinois stood at roughly 3.8 million – about 35 percent lower than in 2000 – despite meager gains in manufacturing employment elsewhere in the country.
Average hourly wages in these sectors, around $34 per hour, remain below the inflation-adjusted highs of the 1970s and 1980s. Many workers today, therefore, earn less in real terms than previous generations did at the height of industrial growth.
Job losses were especially severe in the region’s traditional industries. From 2000 to 2025, steel production employment fell by more than 60 percent, automotive assembly jobs declined nearly 40 percent, and heavy machinery manufacturing contracted by close to 45 percent.
These sectors had long provided stable, middle-income employment, and their contraction reshaped the Rust Belt’s labor market.
Plant closures and relocations further intensified the economic strain. Federal statistics indicate that between 2015 and 2025, over 2,400 manufacturing plants in the region closed permanently. Capital investment remained well below national averages.
Although some surviving firms improved productivity, these gains did not translate into significant job growth. Many industrial centers experienced “jobless growth,” where output rises while employment stagnates.
The structure of regional output has also shifted. In 1970, manufacturing contributed roughly 35-40 percent of state GDP across the Rust Belt; by 2025, that share had fallen to about 18–20 percent.
Service industries expanded during this period, but many of these jobs offer lower wages and less stability than the manufacturing roles they replaced.
Official unemployment rates of 4.1-4.3 percent in late 2025 suggest relative stability, yet labor force surveys reveal that about one in eight prime-age workers in Rust Belt metropolitan areas is employed in part-time or precarious positions.
Taken together, these figures illustrate an economy still defined by industrial contraction. Wage stagnation remains widespread, and efforts at diversification have yielded uneven results.
The Rust Belt has not fully adapted to the loss of its industrial base and continues to struggle with reduced employment opportunities, weakened industrial capacity, and limited economic resilience, with significant social consequences.
What triggered societal fragmentation and demographic decline?
The economic decline of the Rust Belt has produced clear and measurable social consequences. Census data indicate that between 2000 and 2025, populations in major cities such as Detroit, Cleveland, Buffalo, and Gary fell by roughly 15 to 25 percent.
Much of this loss resulted from out-migration as residents sought employment elsewhere. While some suburban and exurban areas absorbed part of this movement, many rural counties, especially those heavily dependent on manufacturing, saw population declines exceeding 30 percent.
These areas have not only shrunk but also aged. The median age in such counties rose from 36.8 in 2000 to 41.5 in 2025, reflecting a steady process of demographic stagnation.
Household patterns shifted as well. Between 2010 and 2025, family households in major Rust Belt cities declined by about 10 percent, while single-person and non-family households became more common.
Younger residents, in particular, continued to leave, leaving behind an older population that is less economically active. This has reduced local labor market vitality and weakened civic participation.
Indicators of social cohesion suggest further strain. According to the US Census Bureau’s American Community Survey, volunteer participation in metropolitan Rust Belt counties declined by 18 percent between 2000 and 2020. Crime rates, especially property crime, remain above the national average in many areas.
Educational attainment also reflects ongoing structural challenges: by 2025, only 28 percent of adults aged 25 to 64 held a bachelor’s degree or higher, compared with 34 percent nationally, limiting upward mobility and reinforcing existing inequalities.
As the economic base contracted, the region’s social fabric weakened alongside it. Long-standing institutions, including schools, civic associations, and cultural organizations, face increasing difficulty operating amid shrinking tax revenues and continuing population loss.
What is the level of poverty entrenchment and inequality there?
Persistent poverty remains one of the clearest outcomes of the Rust Belt’s long industrial decline and accompanying social strain. By 2025, poverty rates in major metropolitan areas remain far above the national average of 11.8 percent: Detroit 28 percent, Cleveland 25 percent, and Buffalo 22 percent.
Rural counties once heavily dependent on manufacturing face similar conditions, with poverty levels exceeding 20 to 25 percent, and in some Ohio and Pennsylvania counties reaching as high as 30 percent. These figures reflect not only past job losses but also the limited growth of stable, higher-wage employment to replace them.
Income inequality has widened alongside poverty. In 2025, the median household income in Rust Belt cities stands at approximately $58,000, compared with a national median of $72,000.
Meanwhile, the top 10 percent of earners account for nearly 40 percent of total income, reinforcing economic divisions within these communities.
Homeownership, long considered a marker of financial stability, has also declined. In cities such as Detroit and Cleveland, homeownership rates fell from 57 percent in 2000 to about 46 percent in 2025. Foreclosure and eviction rates remain above national averages, further undermining household security.
Additional indicators underscore ongoing economic pressure. USDA surveys show that roughly 14 percent of households in Rust Belt cities experience food insecurity, compared with 10 percent nationwide.
Health outcomes mirror these disparities: CDC data indicate that life expectancy in several Rust Belt counties—including parts of West Virginia and Ohio—lags three to five years behind the national average, driven by limited healthcare access and high rates of chronic disease.
High poverty, stagnant real incomes, and strained public services create conditions of long-term economic immobility. In many communities, hardship extends across generations. The region that once symbolized American industrial strength now faces profound and persistent deprivation.
Government policy and amplifying decline
Government policy, both through action and omission, has played a significant role in shaping the Rust Belt’s economic and social trajectory. Trade policy has been particularly consequential.
The implementation of the North American Free Trade Agreement (NAFTA) in 1994, followed by expanded US-China trade relations, contributed to the offshoring of nearly 1.2 million manufacturing jobs from the Rust Belt between 2000 and 2025, particularly in steel, textiles, and automotive parts, according to labor displacement studies.
Lower tariffs and increasingly global supply chains made domestic production less competitive. At the same time, foreign producers invested heavily in automation and efficiency, widening productivity differences and accelerating job losses in older industrial centers.
At the state and local levels, policy responses often fell short. Retraining programs such as Trade Adjustment Assistance (TAA) reached fewer than 20 percent of displaced workers in Rust Belt states between 2010 and 2020, leaving most without meaningful pathways into emerging sectors.
Economic development strategies frequently emphasized tax incentives to attract large corporations rather than sustained investment in small businesses, workforce training, or local entrepreneurship. The result was limited net job creation relative to the scale of earlier losses.
Infrastructure spending likewise did not reverse the broader pattern of decline. Although billions of federal dollars were directed toward urban renewal from the 1960s through the 2000s, cities such as Cleveland and Detroit experienced only modest service-sector growth, while many core neighborhoods continued to deteriorate.
State tax reductions aimed at corporate attraction often reduced funding available for education, social services, and community development, constraining long-term adaptation.
Changes in labor policy further weakened worker protections. Union membership in manufacturing declined from about 35 percent in 1970 to less than 12 percent by 2025, reducing bargaining power and contributing to wage stagnation.
Taken together, trade, labor, tax, and infrastructure policies did not simply fail to halt decline. They shaped the environment in which economic stagnation, social fragmentation, and persistent poverty took root.
The Rust Belt’s current condition reflects policy decisions as much as market forces, with long-term neglect amplifying the human costs of industrial contraction.
How does the future of the Rust Belt look like?
The condition of the Rust Belt is not a closed chapter in American industrial history, but an ongoing process of structural transformation.
Deindustrialization, automation, capital mobility, and population decline continue to reshape the region, producing lasting economic and social effects.
Economic instability, weakened labor institutions, and uneven development have altered community life, creating persistent uncertainty rather than a return to past stability.
Without significant shifts in national or global economic priorities, this trajectory is likely to continue.
The forces behind the region’s decline remain active, influencing work patterns, community structures, and political culture. The Rust Belt should be seen not as a temporary crisis but as an enduring example of how modern economic restructuring transforms industrial societies.

Oil prices hike as Israelis attack deeper into Lebanon

'Iran tax' to squeeze Americans for 'months, probably years' as fuel prices soar: Report

Iran war could add billions of dollars in interest payments to US debt: Report


Leader's advisor: US would enter 'dark and endless corridor' if it resumes aggression against Iran
US-Israeli retreat from bombing Beirut suburb after Iran's warning marks their greatest humiliation
Iran World Cup squad granted US visas ahead of Los Angeles opener: Report
Ireland bars two extremist Israeli ministers from entering country
No point in meeting with Zelensky for now, says Putin after Ukraine president's open letter
France opens 'war crime' probe over Israeli ill-treatment of Gaza flotilla activists
Iran demands immediate release of 50% of frozen assets upon any understanding with US
Iran demands ‘zero-tolerance’ on nuclear strikes, cites 17 US-Israeli attacks against its facilities